Debugging Software
Why Your Code Keeps Breaking: The Definitive Guide to Debugging Software Like a Pro
Let's be honest. As developers, we spend far more time fixing problems than writing new features. You might feel like you're fighting a losing battle against syntax errors, logical flaws, and those mysterious intermittent bugs. Welcome to the relentless world of Debugging Software.
Debugging is not just an unavoidable chore; it is perhaps the most critical skill distinguishing an amateur programmer from a professional engineer. It requires logic, detective work, patience, and a specific mindset. This isn't just a list of tips; this is a guide to fundamentally shifting how you approach broken code, ensuring you find and squash those pesky defects efficiently.
If you're ready to stop randomly changing variables and start using proven, methodical strategies, read on. We're diving deep into the methodology that top-tier developers use every single day.
The Mindset Shift: Why Debugging Software Isn't Just Error Hunting
When most people see an error, their first instinct is panic or immediate blame. A senior developer, however, sees an opportunity to learn. Debugging is primarily about *understanding* the system's state, not just *fixing* the symptom.
The secret of effective debugging lies in scientific methodology: observation, hypothesis, and experimentation. Never assume. Always verify.
Reproducing the Bug (The Crucial First Step)
If you can't reliably reproduce the bug, you can't fix it. It's that simple. Intermittent bugs are often the hardest because they usually involve race conditions, external dependencies, or memory issues. Your first task is to distill the error down to the minimum set of steps required to make it happen. Write those steps down, even if they seem obvious. This documentation itself often reveals faulty assumptions.
The Golden Rule: Never Trust the Tooling
While IDEs and debuggers are fantastic, never assume they are presenting you with the absolute truth. Sometimes, the environment itself is the problem. Always maintain a healthy skepticism, especially when dealing with compiled languages or complex dependency chains.
For a deeper dive into quality control fundamentals, check out this authoritative resource: Software Testing and Debugging Fundamentals (Wikipedia).
Divide and Conquer (The Binary Search Method)
If you have 1000 lines of code and you know the bug is somewhere between line 1 and line 1000, don't read line by line. Use the "binary search" approach. Comment out or isolate the first half of the code. Does the bug still occur? If yes, the bug is in the first half. If no, it's in the second. Repeat this process until you isolate the failure point to a few lines. This is vastly faster than linear inspection.
Essential Tools and Techniques for Debugging Software
Good developers understand their tools; great developers know when to use them and when to step away. While every language has its specific toolkit (GDB for C/C++, VS Code's integrated debugger, Chrome DevTools), the core techniques remain universal.
The Power of Print Statements vs. Debuggers
Debuggers (tools allowing step-through execution) are indispensable for complex logic flows. They allow you to inspect the call stack, watch variables change in real-time, and execute code line by line. However, they can sometimes mask issues related to timing or concurrency.
Conversely, strategic logging or "print statements" (console.log, printf, etc.) are often superior for observing the flow of execution in asynchronous or highly parallel systems. They leave a trail of breadcrumbs without pausing the system's inherent timing.
Understanding Breakpoints and Watchers
Mastering these two features is fundamental. A **Breakpoint** halts execution at a specific line, giving you a snapshot of the application state. A **Conditional Breakpoint** is even better; it only halts execution when a specific condition is met (e.g., stopping the loop only when i > 50). A **Watcher** allows you to monitor the value of a variable or expression throughout the debugging session, immediately flagging unexpected changes.
| Technique | Best Use Case | Speed/Efficiency | Impact on Runtime |
|---|---|---|---|
| Step-Through Debugging | Complex logic, deep state inspection, variable tracking. | Slow (manual iteration) | High (halts execution) |
| Print/Logging | Concurrency issues, flow tracking, large datasets. | Fast (automatic output) | Low (minimal I/O overhead) |
| Unit Tests | Verifying component isolation, regression detection. | High (automated) | Zero (run independently) |
Advanced Strategies: Tackling Hard-to-Find Bugs
When the simple techniques fail, you need to elevate your game. These strategies are often deployed when dealing with production environments or legacy codebases.
Remote Debugging and Memory Leaks
Debugging a remote server can be tricky. Setting up tunnels and remote access points (often through SSH or specialized observability platforms) allows you to attach a local debugger to the running process on a production machine. This is crucial for verifying environment-specific failures.
Memory leaks, where memory is allocated but never freed, are classic examples of bugs that only surface after hours of running. Tools like Valgrind (for C/C++) or Chrome's Memory Profiler (for JS) are indispensable here. They help you visualize the heap and identify objects that should have been garbage collected but weren't.
To deepen your understanding of these system-level issues, we recommend reading up on advanced memory management concepts: [Baca Juga: Memory Management in Programming]
The Power of Source Control (Git Bisect)
If a bug mysteriously appears overnight and you suspect a recent commit caused it, don't manually check every commit. Use git bisect. This powerful command automates the binary search technique across your commit history, allowing you to find the exact commit that introduced the bug in minutes.
The Rubber Duck Technique (A Must-Have for E-E-A-T)
This sounds ridiculous, but it is a cornerstone of professional experience. Explain your code, line by line, to an inanimate object (the rubber duck). The simple act of verbalizing assumptions and logic often forces you to slow down and notice the exact point where reality deviates from your expectation. This is perhaps the cheapest and most effective self-correction strategy available.
For more academic approaches to fault isolation, look into formal studies on software fault tolerance: IEEE Transactions on Software Engineering (Placeholder External Link).
Mastering the art of Debugging Software is not about being smart enough to avoid writing bugs; it's about being smart enough to find them quickly and systematically when they inevitably appear. It's a skill built on discipline and methodology.
If you need structured approaches to prevent bugs from the start, consider exploring formal quality assurance methods: [Baca Juga: Software Testing Methodologies]
Conclusion
Debugging software shifts from a painful guess-and-check process to a logical, scientific inquiry once you adopt a methodological mindset. Always verify assumptions, isolate the failure point using binary search, and leverage your debugger and logging tools appropriately. The ultimate goal is not just to fix the symptom, but to understand the root cause so the bug never returns. Embrace the broken code; it's your best teacher.
Frequently Asked Questions (FAQ) about Debugging
What is the most common mistake developers make when debugging?
The most common mistake is assuming the problem lies where the error message points. Often, the error message (the symptom) is far downstream from the actual fault (the cause). Effective debugging requires tracing the data flow back to the point of initial corruption.
How do I debug intermittent or non-reproducible bugs?
Intermittent bugs are often environment-related (timing, concurrency, external service latency). Focus on aggressive logging, setting up extensive monitoring, and attempting to stress-test the system with varying loads until the condition causing the failure is reliably met.
Should I always use a debugger instead of print statements?
No. While debuggers are powerful for local, sequential logic, print statements (logging) are often superior for observing execution flow in distributed systems, asynchronous processes, or when timing is critical, as a debugger can alter the timing behavior.
What is 'Defensive Programming' in the context of debugging?
Defensive programming is writing code that anticipates errors. This involves aggressive input validation, using assertions to ensure conditions are met, and adding robust error handling (try/catch blocks) even where you don't expect failures. This makes future debugging much easier by immediately catching issues closer to their origin.
Debugging Software
Debugging Software Wallpapers
Collection of debugging software wallpapers for your desktop and mobile devices.
Dynamic Debugging Software Scene for Desktop
A captivating debugging software scene that brings tranquility and beauty to any device.
Beautiful Debugging Software Image Photography
Discover an amazing debugging software background image, ideal for personalizing your devices with vibrant colors and intricate designs.
Breathtaking Debugging Software Wallpaper for Your Screen
Explore this high-quality debugging software image, perfect for enhancing your desktop or mobile wallpaper.

Gorgeous Debugging Software Wallpaper Nature
Find inspiration with this unique debugging software illustration, crafted to provide a fresh look for your background.
Stunning Debugging Software Wallpaper for Mobile
This gorgeous debugging software photo offers a breathtaking view, making it a perfect choice for your next wallpaper.

Dynamic Debugging Software Abstract Nature
A captivating debugging software scene that brings tranquility and beauty to any device.

Exquisite Debugging Software Image for Desktop
This gorgeous debugging software photo offers a breathtaking view, making it a perfect choice for your next wallpaper.

Crisp Debugging Software Background for Desktop
Find inspiration with this unique debugging software illustration, crafted to provide a fresh look for your background.

Captivating Debugging Software Scene Nature
A captivating debugging software scene that brings tranquility and beauty to any device.

Captivating Debugging Software Abstract for Desktop
Find inspiration with this unique debugging software illustration, crafted to provide a fresh look for your background.

Vibrant Debugging Software Landscape for Desktop
Experience the crisp clarity of this stunning debugging software image, available in high resolution for all your screens.

Mesmerizing Debugging Software Photo Photography
Explore this high-quality debugging software image, perfect for enhancing your desktop or mobile wallpaper.

Spectacular Debugging Software Wallpaper Nature
Immerse yourself in the stunning details of this beautiful debugging software wallpaper, designed for a captivating visual experience.

Dynamic Debugging Software View for Desktop
Immerse yourself in the stunning details of this beautiful debugging software wallpaper, designed for a captivating visual experience.

Gorgeous Debugging Software Photo for Desktop
This gorgeous debugging software photo offers a breathtaking view, making it a perfect choice for your next wallpaper.
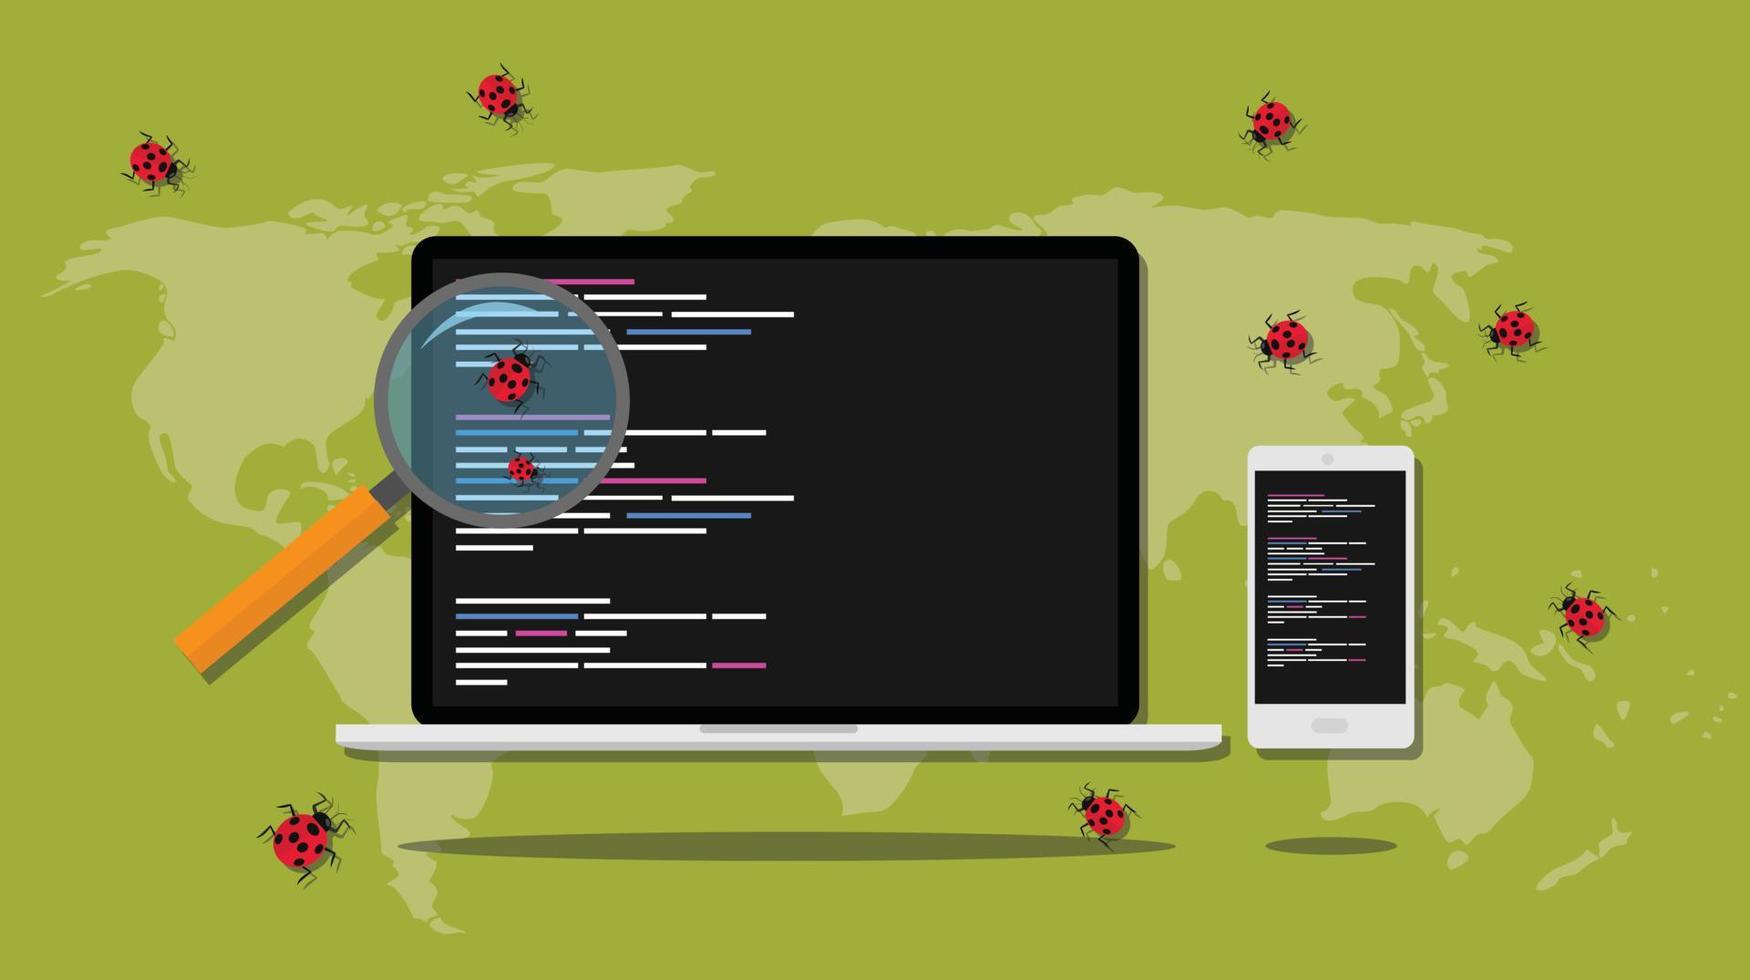
Gorgeous Debugging Software Photo Digital Art
A captivating debugging software scene that brings tranquility and beauty to any device.

Captivating Debugging Software Capture Illustration
This gorgeous debugging software photo offers a breathtaking view, making it a perfect choice for your next wallpaper.

Beautiful Debugging Software Abstract for Mobile
Discover an amazing debugging software background image, ideal for personalizing your devices with vibrant colors and intricate designs.

Breathtaking Debugging Software Capture Photography
Transform your screen with this vivid debugging software artwork, a true masterpiece of digital design.
Amazing Debugging Software Capture Digital Art
Experience the crisp clarity of this stunning debugging software image, available in high resolution for all your screens.
Download these debugging software wallpapers for free and use them on your desktop or mobile devices.